Unity-Graph And Chart U3712
Top-notch 2D/3D data visualization for Unity. Aesthetics, responsiveness and interactivity. Easy to use and quick to set up. Every feature is customizable from code and the editor. Graphs & Charts is compatible with any platform, including VR/AR, mobile, web, and desktop. All latest Unity versions are supported. Integrated with UI Canvas.
Live demonstration
If you have any questions or requests, feel free to contact support:
Email Support | Support Forum
New chart: Pyramid chart now in beta! ! !
New Feature: Competition Bar Chart is now in beta! !
New integration: Integration with 3D text effects. Added full 3D text grid to charts
Documentation Portal | 40-Minute Tutorial Video | Lite Version
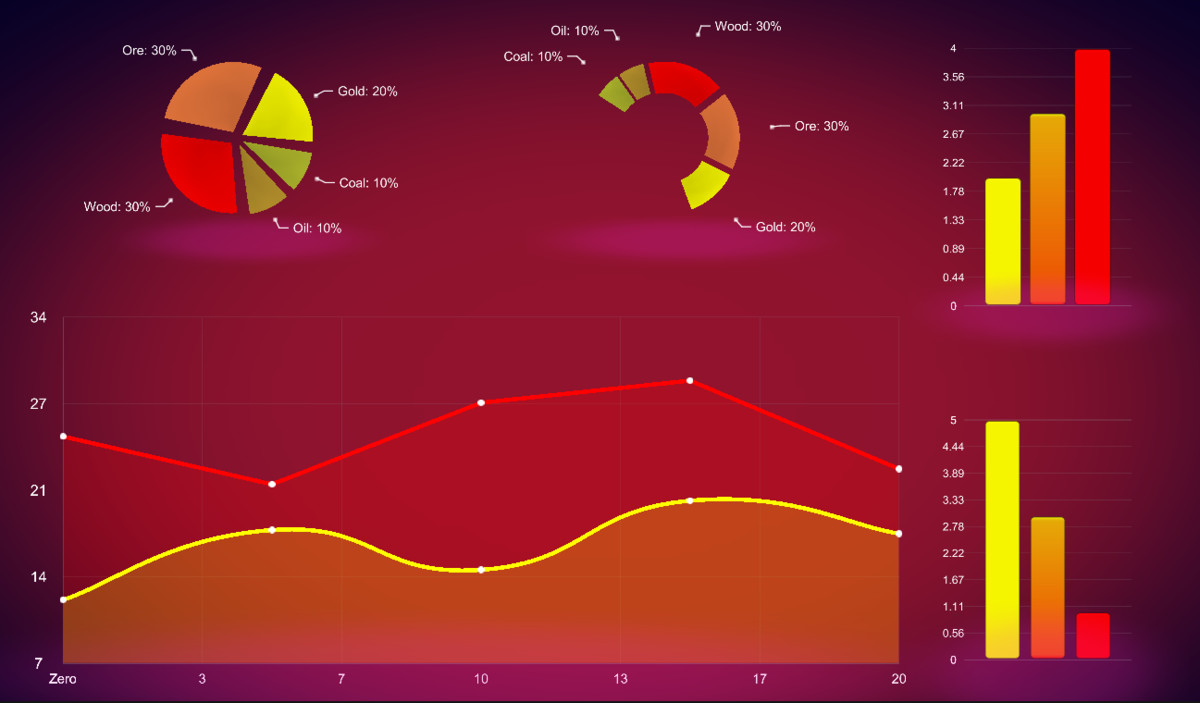
Bar chart (2D/3D), pie chart (2D/3D), torus chart (2D/3D), table chart (live streaming 2D/3D), bubble chart (2D/3D), radar chart (2D/ 3D), candlestick chart (2D) and pyramid chart (Beta 2D). All can be customized with your own colors, sizes, materials and prefabs. All are adaptable to size. All can handle user events.
Can be integrated with a range of other resources and features:
● Playmaker, TextMeshPro, autoload JSON/XML
● supports LWRP and HDRP. learn more…
Graphs & Charts comes with over 30 visual themes, most of which you can check out through the images and videos above. It comes with ready-to-use textures and prefabs for stylizing your diagrams. Additionally, it provides a large number of tutorial scenarios.
“Graphs and Charts” is richly documented and has been maintained and expanded since 2017.
Main features:
● Complete and continuously maintained documentation
● contains complete source code
● Full preview of all charts via editor
● All diagrams are fully configurable through code or through the Unity Editor (no code required).
ɜ All diagrams are fully customizable with your own prefabs, colors, materials and sizes. *Support Text Mesh Pro*
● Loads XML/JSON from a remote URL with minimal setup. learn more…
● All charts support click, hover and leave events.
● dynamically adjusts and adapts to size changes.
● Over 30 preset themes. Check out some of them in the screenshot below. More themes are coming soon.
● includes tutorials that show you how to quickly start using each chart. How to place your own objects on charts and manage large amounts of data.
ɜ Axis components include custom materials and appearances, date labels, formatting labels, and texture splicing along the axis. Any aspect of the axis can be set using your parameters including: sector statistics and gaps, thickness, label positioning, etc.
● 2D/3D adaptive bar chart with labels and axes. Supports multiple categories and groups. Automatic animation on mouseover. Animate the bars based on different values. Strips can be placed in layers. Bar distances, bar group distances and axis positions are all easily configurable. Label position can be configured via offset and bar alignment. Bars can be set up as your own prefabs (so they can be any shape), and there are ready-to-use prefabs for smooth and cylindrical bars. Everything is customizable
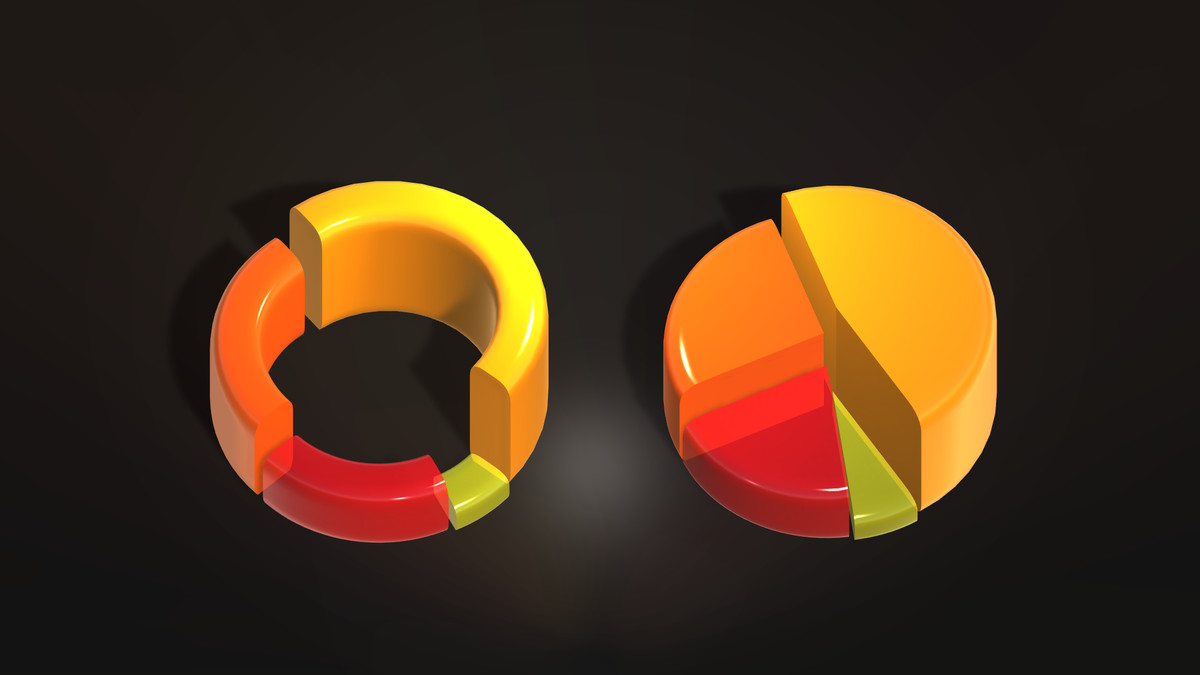
● 2D/3D adaptive pie charts and torus charts with labels. Automatic animation handling via mouseover. Can be animated based on changes in value. Individual items in a pie chart can be squeezed, thickened, and otherwise controlled individually or all at once. 3D pie charts can be smoothed around the edges. Everything is customizable.
● 2D/3D adaptive chart with multiple categories, line fills and point markers. Supports straight lines and curves. Automatically animate via mouseover. All visualization components are fully customizable with your own dimensions, materials, and prefabs. Supports texture splicing of lines and fills. Dashed lines are supported. Graphics are scrollable, zoomable, and panable. Supports automatic scrolling. Fully configurable tags and formatting. 2D graphics support real-time drawing.
● 2D/3D adaptive bubble chart, which is actually a chart extending from the bubble. Make it extremely feature-rich. Everything is customizable.
● 2D/3D adaptive radar chart with multiple categories, line fills and point markers. Automatically animate via mouseover. Everything is customizable with your own prefabs, materials, colors and sizes.
ɜ 2D adaptive streaming candle chart with multiple categories, fills, tips and overviews. Automatically animate via mouseover. Everything is customizable with your own prefabs, materials, colors and sizes.
● A legend prefab that works with all types of charts.
● Chart animation for bar charts, pie charts, donut charts and 2D graphs
● Contains gradient materials suitable for canvas and world space.
● includes pre-made textures for line styles and point styles, as well as prefabs for use with all charts.